


America's mysterious labor market.
Too many divergences.
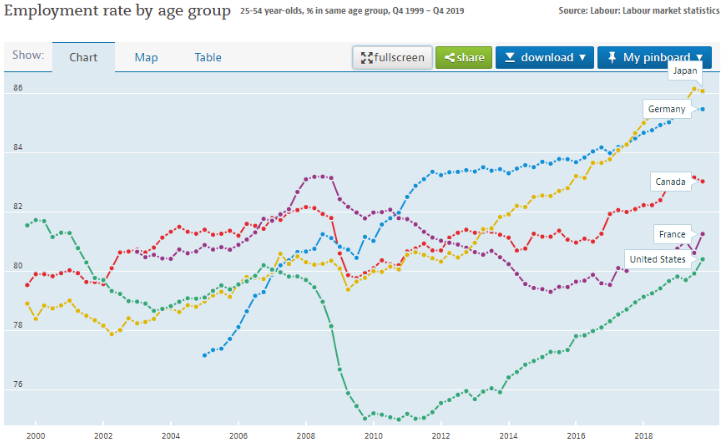
Over the last couple of decades the U.S economy has become increasingly puzzling. Asset prices are very high, but business investment is low. Corporate profits are a larger share of national income, prompting many economists to wonder if monopoly power has increased. And then there's the labor market. The U.S employment to population ratio has fallen since 2000 while it has risen everywhere else.
The magnitude of the divergence between the U.S and the rest is considerable. Back in 2000, the U.S epop ratio was one of the highest in the world. Only a handful of countries, mainly the Scandinavian economies, had higher participation rates. But by the end of 2019, (i.e. before the pandemic) the U.S epop ratio had fallen to one of the lowest in the OECD, and far behind its peer group. The U.S prime-age epop in 2019 was 3% lower than Canada, 4% lower than the U.K, 6% lower than Germany, and 7% lower than Japan. It was even 1% lower than France.
The employment-population ratio is the first labor market mystery. But another mystery is the divergence in the duration of unemployment between the U.S and - again - everyone else.
The duration of unemployment is the length of time, measured in weeks, that people spend actively searching for jobs. When unemployment is low, as it was in the U.S in 2000, the duration of unemployment is also low, at just 12 weeks. Fast forward to the end of 2019 and unemployment was even lower, 3.6% compared to 3.8% in 2000. But look at the duration of unemployment! It's over 50% higher than the level in 2000 and is equal to the highest level following the 2001 recession when unemployment was still elevated - unemployment was over 6% as late as 2003.

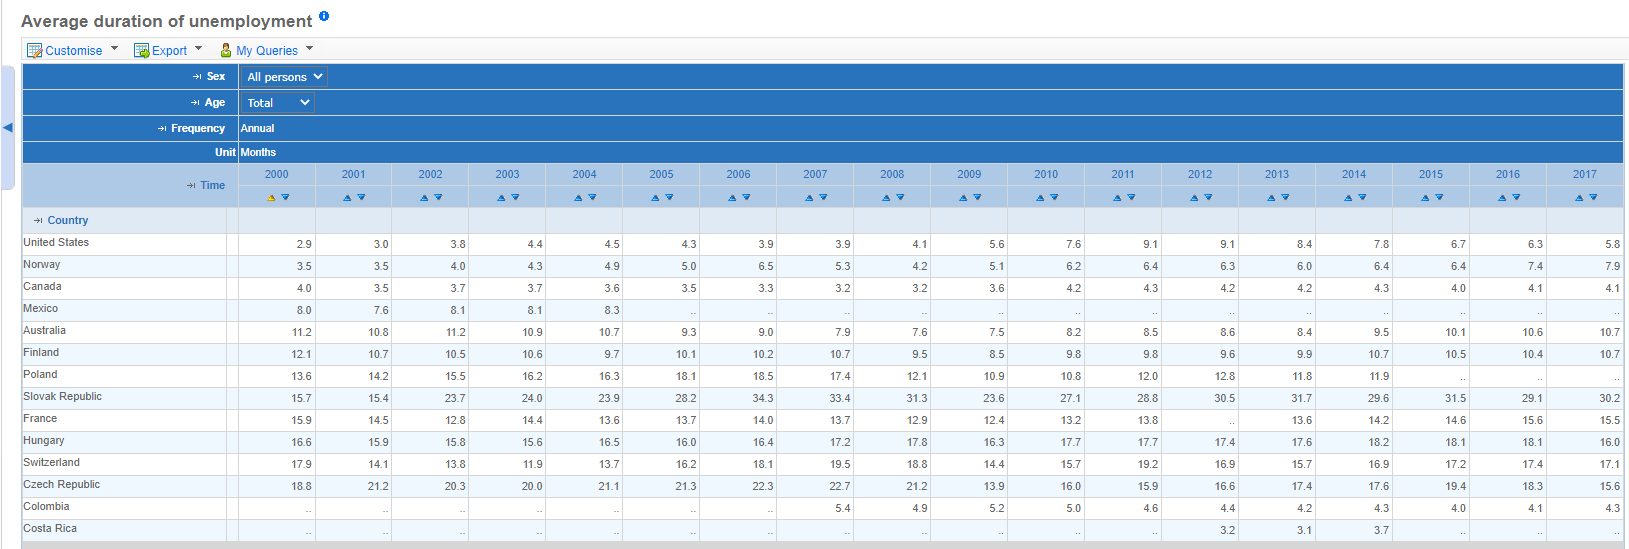
This table shows duration1 data for a number of countries up to 2017. Norway and the Slovak Republic are the only countries with higher durations than 2000 levels. Norway had high unemployment in 2016, while Slovak changed its data methodology in 2002.
To point out the obvious, it can't be a coincidence that both the U.S duration of unemployment and U.S epop have diverged from the rest of the world. But what is the connection?
It's reasonable to infer that the duration of unemployment has increased because people are actually having to send in more resumes and interviews to get a job offer. What is needed then is some mechanism or force which can produce an increase in job searching.
To cut to the chase, the mechanism is higher effort levels being demanded of workers by U.S firms. How does that affect job search costs and participation rates?
1. Firms impose higher effort demands on workers; workers have to complete more tasks (for a higher wage) or be fired.
2. The higher wage does not compensate workers for their lost work leisure; thus workers look for less demanding job positions (or refuse to move up to more senior roles).
3. If one imagines a skill ladder, then all workers attempt to drop down a rung. This is easy for higher skilled workers, but what happens to workers at the bottom?
4. The lowest skilled workers compete for job openings with somewhat more skilled workers. Firms prefer to hire the more skilled worker, resulting in the lowest skilled workers being pushed out of employment altogether.
5. This assumes that employers can always identify the highest skilled worker from their pool of applicants. This won't always be the case; if the higher skilled worker has a bad interview or the weaker candidate has positive chemistry with the interviewer, then the objectively weaker candidate can win a job offer.
6. Thus provided the lowest skill workers are willing to keep searching for jobs they will eventually obtain a job offer and regain employment.
7. This means though that workers on the second lowest skill rung will be unable to drop down to the lowest rung unless they also increase their job search activity. And in turn, this forces the workers above them to increase their job search.
8. Any person wanting a job now has to apply to many more job positions before they can get their first job offer. But after a string of failures, job seekers become discouraged and temporarily withdraw from the search process. It is this temporary withdrawal that is responsible for the drop in labor participation (and epop). For those who are the main breadwinners, the period of withdrawal will be short - perhaps only a few months. But for workers who are more marginally attached to the labor force, it could be years or forever.
9. Evidence for higher effort in the U.S can be found in the higher U.S productivity growth since 2000 vs peer economies.
10. As noted above evidence of higher job search can be found in the elevated duration of unemployment, which in 2019 was still equal to recessionary levels. The American Time Use Survey also shows higher than normal time spent on job search.
A coda to this ten-point sequence. Job search costs have not increased equally. It’s a bit complicated to explain here, but job search costs have increased most for those at the bottom of the skill ladder and then diminish as you go up the income scale until, by the time you reach the top, job search costs have only increased by a negligible amount.
At the bottom of the skill ladder, job search costs have doubled compared with a 50% increase on average, and this is reflected in the biggest fall in labor participation.

I use 16-19 years olds as a proxy for the lowest skilled workers.
This fall in the employment-population ratio is similar to the rise in unemployment that takes place in a recession. During a recession, firms lay off workers and reduce hiring. This results in fiercer job competition as more applicants chase fewer job vacancies. In the case of the effort driven fall in labor participation, the reverse happens: there is first an increase in job search costs, people become discouraged from failing to obtain a job, and this leads people to stop searching for jobs (at least temporarily) and thus labor participation falls.
Regardless of the cause, the high level of the duration of unemployment implies that the labor market is weak. The defining feature of a weak labor market is that workers fear being laid off. Not because the chance of lay-offs is higher, (which only happens for a brief time during a recession) but because once people are out of the workforce it is harder to rejoin it.
There are two more pieces of evidence for a weak labor market. The first of which is the housing market.
This is a puzzle in its own right and can be stated quite simply: why has housing construction been so low over the past two decades? There has been a shortfall of new houses even if you include the mid-2000s housing boom, and there has been a further drop since the bust.
It cannot be because demand for housing has fallen - housing rent as a share of national income in 2019 was higher than in 2000.
This suggests that supply is the problem. Perhaps zoning has become more restrictive etc. Actually, the cause of low construction is one of low demand. However, this is the demand for housing ownership, not housing demand per se.
A weak labor market makes people reluctant to take out a mortgage and buy a home. Instead, they prefer to rent. This pushes up rents in rental properties while depressing the price of family-owned homes. Developers of course respond to these relative price movements by increasing the number of apartment buildings, which are mainly rented, and building fewer single-family properties, which tend to be occupant-owned.
You can see this shift in the following chart: multifamily construction was only 20% of the total in 2000, by 2019 it was 30%.
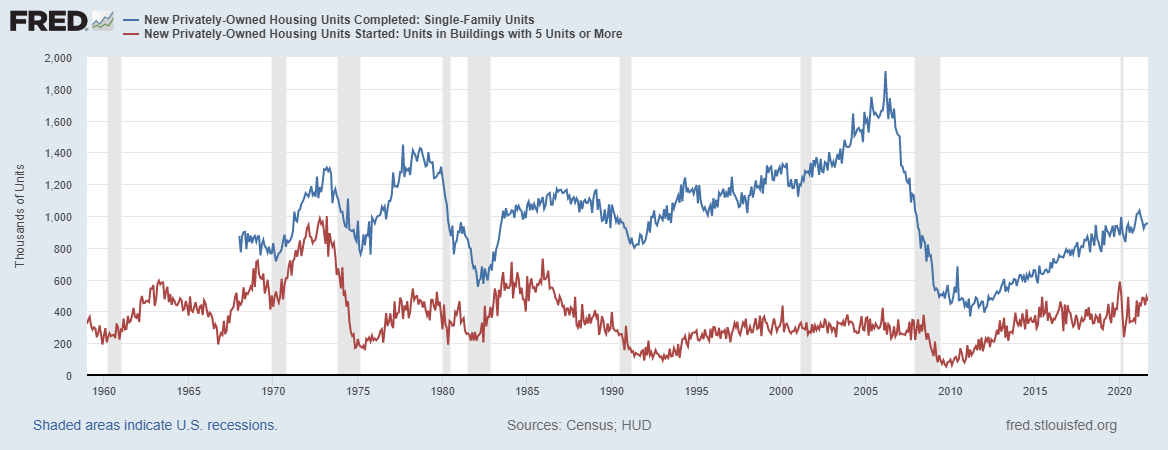
The increase in multi-family construction does not equal the decline in single-family construction. That's because it's always been harder to get permission to build apartment buildings compared to detached houses.
The second piece of evidence for a weak labor market is a bit more speculative and that is the rise in deaths of despair: deaths due to suicide, drugs, and alcohol.
Back in 2000, the U.S had the second lowest suicide rate of the G7 nations. Twenty years on it had increased by about 30% and is now the second highest. In all the other countries suicides were flat or had decreased.
A similar story applies to opioid deaths. Deaths due to opioid use have risen in many countries, but two things stand out in the U.S. First, the magnitude of the increase, and secondly in most other countries deaths due to alcohol use have fallen, which is consistent with people switching from alcohol to opioids. In the U.S deaths due to alcohol have increased. This suggests that some Americans are indeed switching from alcohol to opioids, but this effect is being masked by the huge increase in demand for all mind-altering substances.
A weak labor market may be a factor behind this. Countries that had far worse unemployment, such as Spain and Greece, have not seen huge surges in deaths of despair, but in those cases, everyone was aware of the poor economic environment and therefore it would be understood that obtaining employment is difficult. In the U.S, the labor market has always been substantially worse than the headline unemployment figures would imply.
Even if one accepts that the labor market is weak and even if you think it plausible that rising effort levels are the culprit, there are still many questions left to be answered. Why has this happened after 2000 and not before? Why only in the U.S and not elsewhere?
These questions will be answered in future posts.
Most countries on that list have higher duration of unemployment than the U.S but that is because they use a different definition of unemployment. The U.S (and Canada) define unemployment as time spent actively searching for a job. The other countries use time since last employed.
Tiramisu, thanks for your comment.
Firms will pay workers a higher wage for higher effort. So for every 1% increase in effort they will pay 1% more in wages. That's valuable for firms because all the capital that workers use will be utilized 1% more as well.
Why don't workers want this additional pay for more effort? It's the same reason workers want a higher rate for overtime - beyond a certain level of effort, workers value their leisure more than an increase in income.
You write: "What's the link between this phenomenon and the increase in house prices? That's a genuine question, it's not obvious to me"
Do you mean the increase in house prices during the 2005 period or more recently? There is no connection between the housing bubble in the mid-2000s and higher effort levels.
Very interesting ideas. Regarding the housing market, there's a fair argument to make that, until 2020, America never recovered psychologically from the 2008 meltdown, even though prices had long been rising. You hit on a correct theme of zoning and permitting, and in fact the cost of all permits, even single family, has SOARED post 2008, even outside of the normal California culprits.
You're also on the right track with the narcotics angle.
However, might I posit your piece in a slightly different way? Considering the socio-cultural impediments that exist in the US population relative to the result of the world, its a surprise that the US ePop ratio is ANYWHERE near European nations at all. The US adult Obesity rate is 36% versus 20-22% for europe (UK 25%), while 8% of US adults have a felony conviction on record vs likely 1-2% for Europe. Couple that with your aforementioned narcotics use, suicide and (likely undiscussed) - mental illness and homelessness. These factors all have devastating impact on employment rates and should permanently depress the US employment rate, which has largely not been the case.
https://obesity.procon.org/global-obesity-levels/
https://techjury.net/blog/criminal-record-statistics/
However, these factors did not magically appear recently, and they were a factor in 2000, and 2005 , even when the US ePoP was still similar to Europe. Post-2008 is where ePop really drops. And I think, this too is explainable. First culprit has to be Grad school, as this should knock out a portion of the 25-40 labor force. Official graduation statistics show a 25% increase in Masters degree graduation rates from 2007 to 2012 (but of course, that’s just graduation) – and anecdotes did suggest that a large portion of people did ride out the 2009 recession in various forms of grad school and that might not fully reflect in grad rates. But, what’s pretty clear is that Masters/Doctorate degrees (and even bachelors to a lesser extent) remain sizeably elevated since 2005 and, based on the grad rates per year, should account for at least 1% decline in ePoP, if not more.
https://educationdata.org/number-of-college-graduates
Next is construction. As you and I agree – US construction has been in an almost 13-year hiatus from normalcy. Construction wages have been growing for sure over the past 5 years. But it certainly poses the question – what happened to all the construction laborers from 2007 – 2011? How many were able to retrain? What would be intriguing to look at is the ePoP data as it related to a larger economy with substantial amount of unskilled labor that experienced a housing crash – perhaps Italy, but especially Spain. Spain’s male 25-54 employment rate CRATERED compared to the US. It fell a full 18%!! Of course Spain’s economy was hit harder, but its also heavily construction based, and even though construction returned, you can see that the participation rate is still several percent below 2008 levels.
https://fred.stlouisfed.org/series/LREM25MAESQ156S
Third, we have to consider austerity. But I’m not talking Federal, which is small potatoes, I mean state. Even though federal spending has been growing, states have mostly collectively cut spending, often massively, since 2008. Even as borrowing rates were fractional, states cut services, and much revenue was allocated to pensions. State government labor loss shares a similar fate to construction labor – it requires retraining and cannot be easily transitioned.
Fourth, and this one I can’t quantify as much, but it’s a good sense for why the ePoP gap may not narrow as much going forward in the US. Small business applications have been immense in the US post-COVID. And I’m not entirely certain that every small business owner will always show up in the employment statistics
https://fred.stlouisfed.org/series/BABATOTALSAUS
And finally, and maybe more importantly, lets consider the following fact. From 2015 to 2019, the US ePoP rate increased 4 full points, and massively narrowed the ePoP gap relative to the rest of Europe. The US is a far more divided society with a substantially larger portion of the population that is unable to participate in society’s benefits relative to Europe. So to see that the gap has shrunk as much as it has is, imo, a testament to the US resilience, rather than a symptom of its issues.